

Finding defects with AI and computer vision
In March 2018 a number of stars aligned in a way that would have a lasting impact.
Firstly, I was looking for a new personal project to help me learn more about artificial intelligence and in particular computer vision.
Secondly, one of our global partners asked my business if we could help them solve a difficult visual defect detection problem for one of their clients.
Thirdly, my Data Science team was fully booked so the client director took a chance and gave me a call to see if I was personally interested in helping out!
I thought about it for 5 seconds… and then said “yes, definitely!”.

If you like visual explanations, you can get a pretty good summary of the project by watching this video that I made at the time. It wasn’t meant to be part of a blog, I was just sending a quick explanation to the client director.
If you have a look, please excuse the audio quality, my laptop was doing the image processing in real time and also recording the audio too. It just about manages it but the audio quality was definitely sacrificed!
That’s not a bad summary, but if you’d like to read about the journey as well, then I try to cover that in the rest of the blog
Prologue or “A short while before… “
About 12 months earlier, I’d led a small side project to try and find an innovative way of helping another client (a major grocer in the UK) analyse the aisles using computer vision to make sure every item on a shelf was placed and promoted correctly. The consequences of getting that wrong are pretty severe and directors can find themselves in the courts if the organisation didn’t make good efforts to ensure it can’t happen. We weren’t able to find a great way forward at the time but my first foray into this world taught me a great deal.
I should probably add that at the time I was at the beginning of some medical difficulties that made it problematic for me to travel. I had to step back from my CEO role and I was helping out by consulting on an ad-hoc basis while I recovered (but that’s another story!).
So what was the problem that our partner brought to our table?
A blow moulding manufacturer occasionally shipped bottles that had a fault in the structure caused by a small piece of degraded plastic in the wall of the bottle. Sometimes there would be a small hole, sometimes the structural integrity would be compromised and a split could open up later. Either way it was bad news and their clients would understandably get very upset if a bottle failed on their production line. The contents could spill out causing everything to stop for a clean up.
To mitigate that, the bottle manufacturer had put in place a 100% visual inspection team.
Our eyes are amazing, they can detect tiny variations in colour or shade and discern patterns in a jumble of noise. But, we get tired, we get bored, we can be tricked and we get distracted!
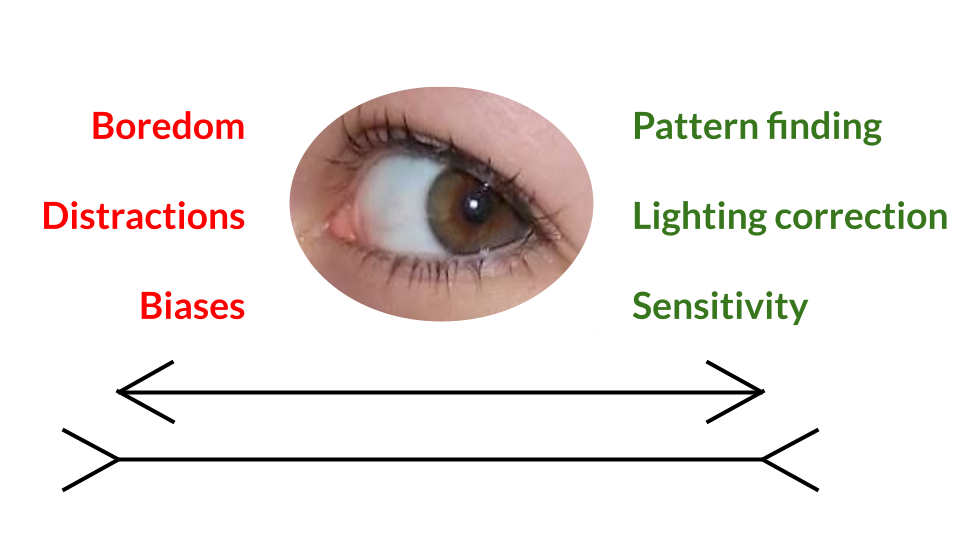
Pros and cons of using our eyes to detect defects or features
The client team reduced the problem but, as humans, we are fallible and defective bottles still slipped through.
The unit price and margins were pretty low so expensive capital equipment was hard to justify and our partner agreed a scope with us to see if we could create an innovative solution using low cost components that could minimise the number of defective bottles shipped.
Plastic bottles????
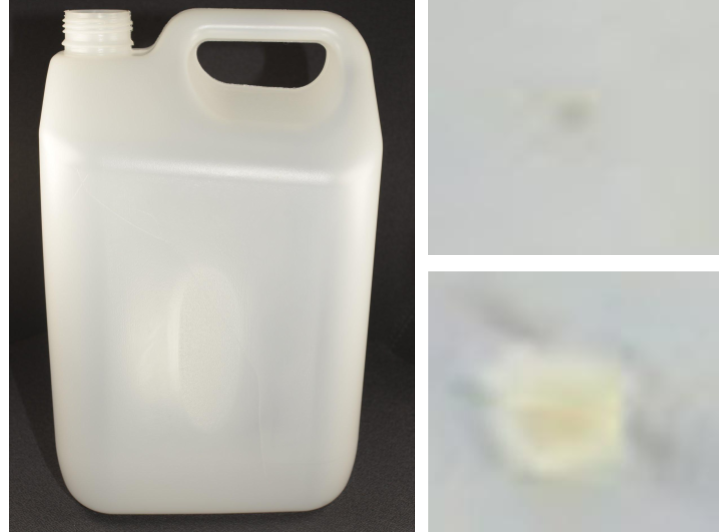
This is the sort of plastic bottle that we are talking about. The two smaller images are zoomed in images of the defects. The bottom is about 5 mm across and is the most severe example of a defect that we saw in the sample bottles provided.
The top defect was much more typical, they were usually 1mm or less across and they weren’t really easy to see with the naked eye!
First… Have a look at the data
Often we read about projects like this and there’s a handy folder on github with 20,000 images split into defect and no defect with the locations of all the defects available in an annotations file.
No such luxuries here!
The client director visited the factory and on the drive back, their car was packed full with about 50 defective bottles! Living the dream!
It wasn’t very easy to identify the defects with the naked eye and we started to take photos with a variety of cameras under different lighting conditions so that I could eyeball the digitised data.
If the defects were a bit tricky to spot in real life, they were extremely challenging to find in the digital images!
Forensic style deconstruction of the images showed that:
- the variations in pixel brightness across an image were much greater than the local variations in pixel brightness between a defect and a non defect area
- The colours that I could find in a defect all existed in the same image in a non defective location
- The colours and the brightness of the pixels in the defects had a massive variation dependant on the defect in question, the location on the bottle, the lighting conditions and the camera type
I concluded that we’d increase our chances of success dramatically if we managed the lighting conditions and the first controlled digital capture booth was soon built. It might sound technical but the reality was some bits of old hardboard gaffer taped together, led lamps wedged against the front and a camera strapped to a tripod.
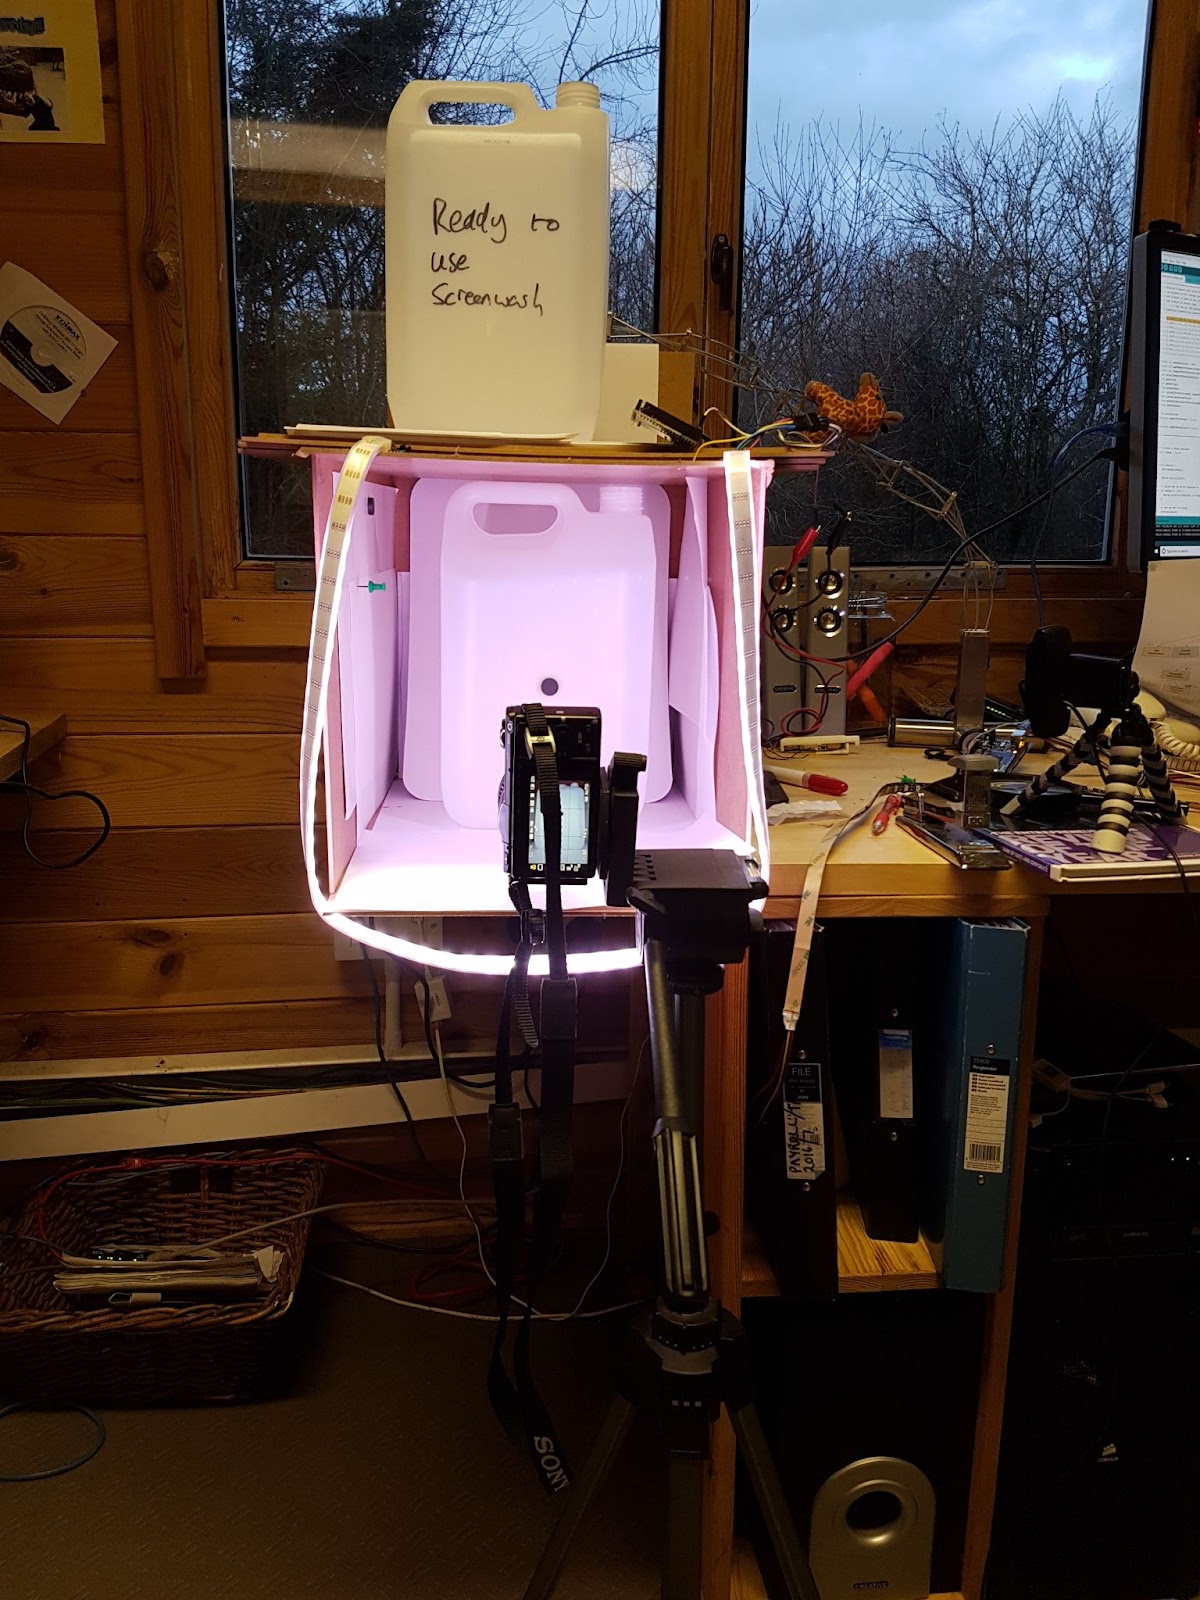
One of the first iterations of a controlled digital capture booth
The bottle was placed inside and the image captured.
Rotate the bottle 90 degrees – repeat 4 times.
Get the next bottle – repeat 50 times.
Each bottle was labelled and tied to the image with documentation
Then I created an annotations file by painstakingly scrutinising each image and identifying the precise location of each defect on every image. My eyes boggled and plastic bottles even invaded my dreams for a few nights.
And….
I learned a lot about the different types of defects, what they looked like and the various methods they used to try and avoid my searching eyes!
And then step back…
It’s important to remember that this wasn’t a well funded, life and death computer vision problem in the medical domain. The margins were low, and we needed to keep a constant eye on what a finished solution might cost to deploy for each potential solution on the list.
There are many ways this problem could have been solved and some methods available to us in 2022 weren’t so obviously available in 2017.
My draft strategy emerged as I poked and prodded the data using various tools to gain a deeper understanding of the nature of the defects and the bottles they inhabited:
Strategy for Phase 1 – Proof of concept
- Develop a Region Of Interest feature identifier that could find potential defects.
- Analyse the ROIs to extract features to be used as inputs to a custom designed neural net.
- Train a neural net to distinguish between the extracted features of the ROIs where an actual defect was present and other ROIs where there was no defect present
- If false positives (the system thinks a bottle has a defect when it’s actually ok) were ok in the ROI identification phase, they were definitely not ok in the Neural Net categorisation phase. A false positive means that the bottle would be thrown away or set aside for manual inspection. Either of these options had a significant impact.
- And if a defective bottle managed to sneak through with a clean bill of health, the impact on their clients happiness could be severe with consequential financial penalties or even loss of business. Missing defects would be bad. Don’t do it!!
- Consider the cost to deploy and support the solution into a production environment
The ROI Identifier should d have the following attributes:
- Work within a range of defect sizes (between 50% of the smallest defect and 200% of the largest defect found)
- Work whatever the location of the defect
- Work whatever the local brightness conditions
- Work whatever the orientation of the defect
- Must find every defect
- A high level of false positives is acceptable
The analysis of the ROI should extract such features as:
- Histogram of hues
- Histogram of relative brightnesses
- Histogram of oriented gradients
- A 5 by 5 pixel normalised and compressed image of the ROI (most of the defects were about 50 pixels wide so this was a severe compression)
- Etc. many more extracts were calculated and tested
Execution
Over the next 20 days or so I immersed myself into the world of blow-moulded plastic bottles and finding a robust way of identifying the ones that would fail.
In the end, I designed a great method of identifying the potential regions of interest that was immune to local brightness, size and orientation – it was old school computer vision and if you’d like to know more, please shout!
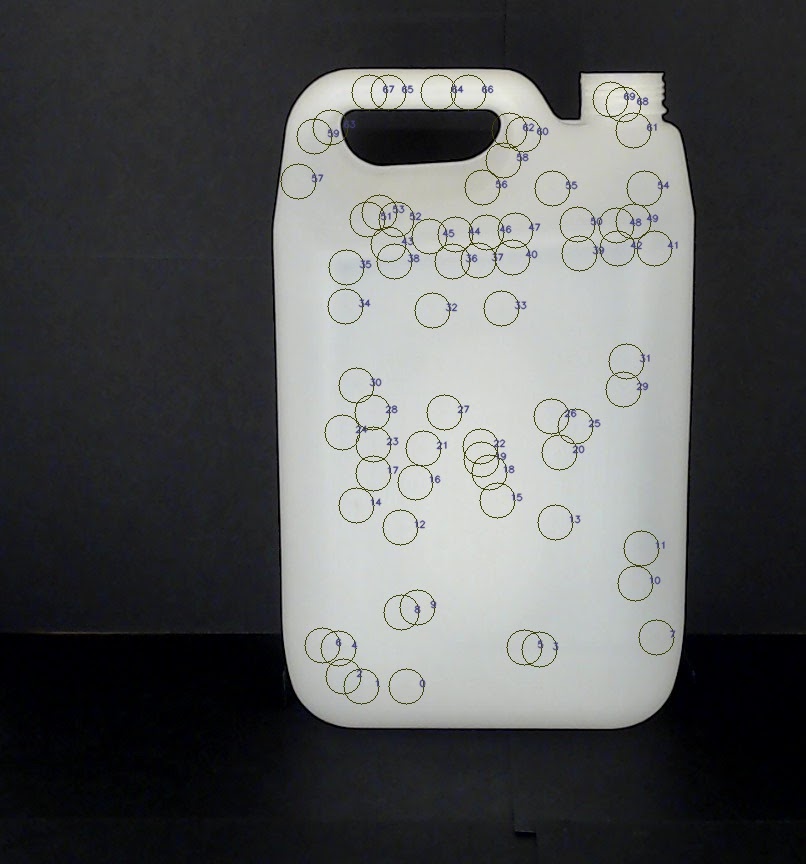
Plastic bottle with marked up Regions of Interest (that may or may not contain a defect)
In this image there were over 50 potential defects found in the ROI detector phase – it might sound a lot but it meant that every single defect was identified successfully using the method
I extracted numerous features such as the histogram of RGB shown below for all of the defects

A barely visible defect with the histogram of RGB values (a feature) extracted

A clearly visible defect with the histogram of RGB values (a feature) extracted

The largest defect on any of the bottles – again with the RGB histogram
I took a subset of the defects and I rotated, flipped and warped them like there was no tomorrow.
I ended up with about 50,000 derived examples of defects and I used those to train a custom designed neural net.
I experimented with different combinations of extracted features to use as the input nodes for the neural net and found that the histogram of rgbs combined with the normalised 5 by 5 image of the ROI gave the best performance.
The results…
There was so much data from the categorisation run, I needed a way of visualising so that I could easily understand what had happened
For each image, I circled the potential inclusions (sample of them shown in this image) and the actual inclusions…
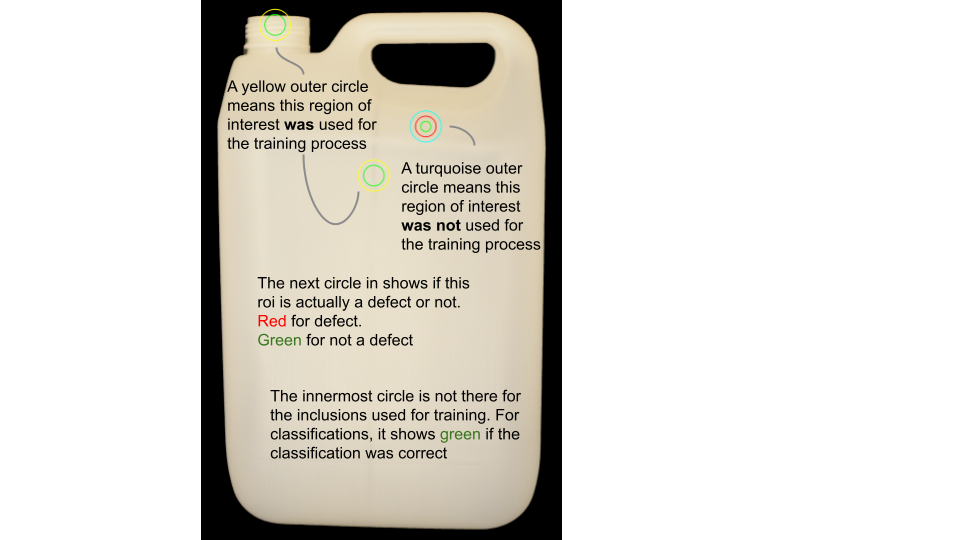
Visualising results – training ROIs and unseen ROIs with truth encoded into coloured rings
It probably seems a bit complicated on first reading, but it allowed me to very quickly establish what was happening for the many iterations that I ran during this period.
Of course I also created a single line summary for each run so that I could tell at a glance how the iteration had performed. The best results I achieved showed that for all of the 4000 or so warped, rotated and flipped derivations of the unseen defects, the neural net correctly classified all but 1 of them.
So on one level, the POC was definitely a success. We built a process to capture the images in a controlled environment that could easily be replicated on the production line, built a two pass model that correctly identified almost all of the unseen defects and we did this with a limited amount of data, some old school feature extraction and a custom built neural net.
However, we also concluded that the cost of building out the data pipeline to a robust level of engineering and the subsequent cost of supporting that would be too high to be economically viable.
And finally…
There is a wealth of technical detail that I’d lined up to include in this blog but in the end, I decided to go for a shorter version.
It’s still longer than I’d like but if you made it to here then thanks for reading and I hope you found some value.
If you’d like to know some more about the work we do at dt-squad or…
If you have your own computer vision problem that you’d like to explore, please don’t hesitate to give us a call. From counting birds nesting on a cliff side to checking the presence of critical equipment in a kit (or anything in between), we’d love to talk.
Peter Brookes-Smith
Curious problem solver, business developer, technologist and customer advocate
Other blogs by Peter
- Needles and haystacks or…
- The Case of Rev. Bayes v The Post Office
- Lighting a fire – Our first annual review…
- Helping Mine Detectors learn to use their equipment correctly
- How many?
- Portfolio: PBS – Neural Net for Hand Written Digits
- CS50 – Harvard’s Open Computer Science Course
- What is a neural net anyway?
- Values Driven Business
- All things come to those that wait…
- Monte Carlo or Bust!
- What is business agility? And why should I care?
- Are values in business our fair weather friend?
- Lessons in life from an ai agent
- Five tools for innovation mastery
- Value for money
- Award entry for European CEO Magazine 2017
- Darwin and The Travelling Salesperson
- What is this DevOps thing?
Blogs by other authors:
- From Stubble to Squad Goals: Our Mo-numental Mo-vember Mo-arvel!
- Learning a Foreign Language vs. Learning to Code: What’s the Difference?
- Solving complex problems through code – and nature!
- In it together – why employee ownership is right for us
- Old Dogs and New Tricks: The Monte Carlo Forecasting Journey
- Portfolio: Rachel – Photo Editing
- Portfolio: Luke – Hangman
- Portfolio: Will – Gym Machines