

Monte Carlo or Bust!
…or Forecasting Sales using Randomness.
This blog is also available as a video and you can see it here:
In 2015 I was running a technology services company and for their own completely legitimate reasons, one of our largest clients told me they needed to reduce the team size by about 90% (and could be higher). It was inevitable that this would create some stress in our business! But how much stress? And what could I do?
This blog is part of my occasional series showing how concepts from data science and ai can help to solve real life problems (mostly). The situation I describe here was real. The stress on our business was real. The methods I describe are an amalgam of my first few iterations towards a result that I was confident in.
So, our business was in trouble. I knew that making some of our people redundant was my solution of last resort and that I’d leave no stone unturned to find a way through that was good for everyone.

But how would I know when I’d reached the last stone?
Cash would become tighter and I knew I’d need the support of our bankers. I could foresee a day, many months in the future, when I would be in a room trying to convince some very serious players that our credit lines should remain in place. If that meeting went badly then it could be “Game Over”
- What analysis would I want at my fingertips should that day come?
- And what should we do now so that we’re prepared and not panicking at the last minute?
I turned my attention to our sales forecast which of course is a critical input to the cash flow statement and understanding the general health of the business.
For a number of years prior to that, our growth had been constrained by the rate at which we could increase our capacity (recruit and integrate more people). Our sales forecasting was no more sophisticated than it needed to be (fairly primitive!). Clearly, that wouldn’t suffice in our new world!
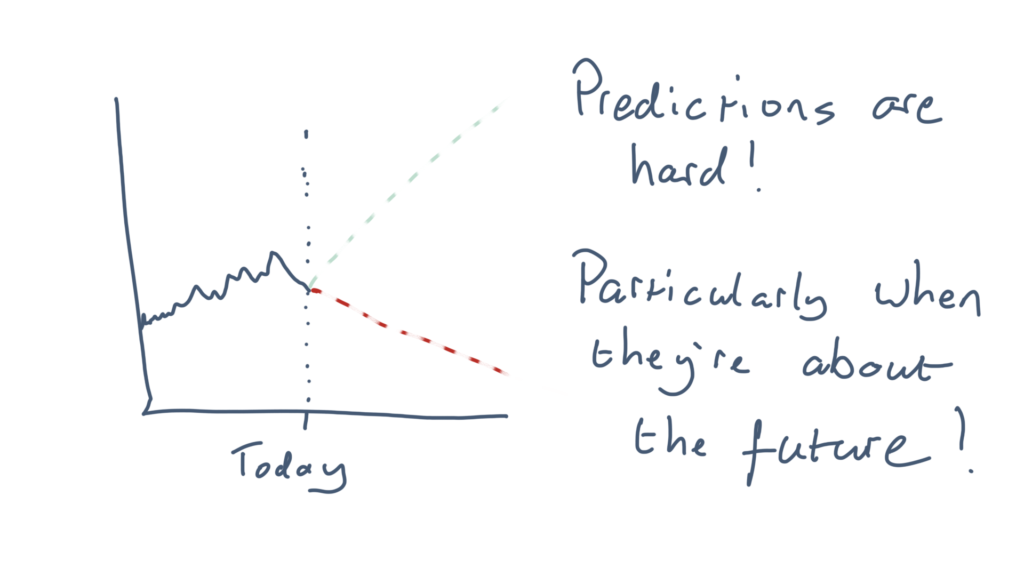
Someone said that “predictions are hard, particularly when they’re about the future”. And our sales forecasting problem threw up its own challenges.
Our sales teams were talking in detail to about 30 organisations at any one time. That included stuff that we were just about to win, right down to projects where we might have had a few meetings, established there was a project with some budget and we were discussing specific ways to engage. On average we would be discussing 3 or 4 opportunities per client.
So our list of opportunities that were sufficiently strong enough to have an influence on our forecast ranged from a few tens of thousands of pounds for early engagements like Proof of Concept or Workshops through to many hundreds of thousands for large scale transformation work that could last many years.
The start dates varied from imminent to more than 6 months away.
The percentage certainty that we would win varied a lot too:
- 95% (we’ve been awarded the work, the PO has been issued but we don’t have it yet)
- 5% (there is a piece of work, we are on a short list, they like us and procurement is about to kick off)
With all those variables, it’s not a trivial problem to solve and if we consider just the following (fictional) potential revenue streams:
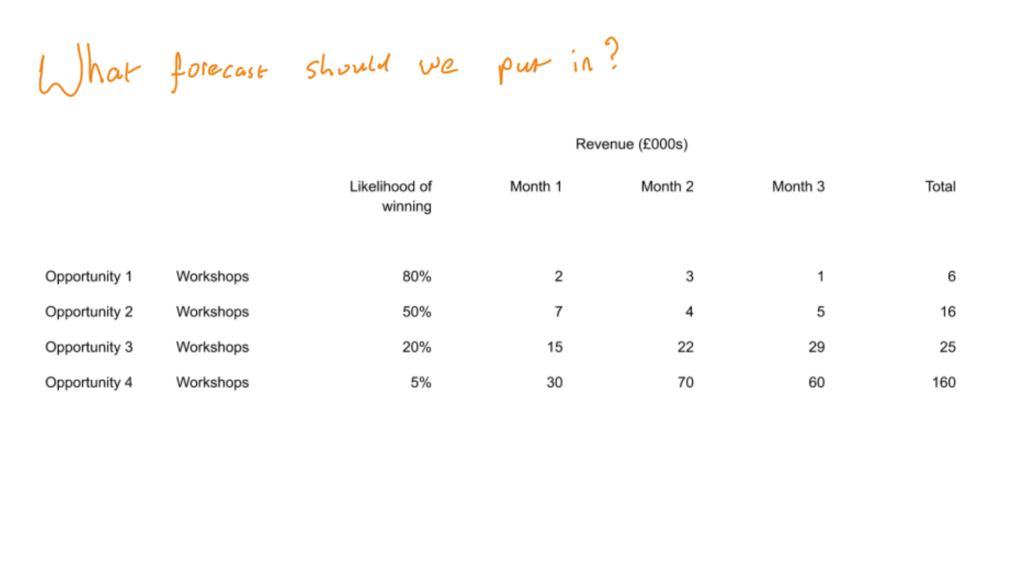
How much would you tell the bank was in your 3 month revenue forecast?
We considered a number of ways to solve:
- Choose a cut off percentage (say 75%) and add up everything above that
- Multiply the revenue by the chance of winning and use that
- Something else!
There are at least three problems with the threshold approach:
- It’s just too naive! It assumes that we will win everything above that threshold and nothing below
- It focuses our minds on a single number to represent all possible futures and can deceive us into believing that number is the truth
- It changes people’s behaviour. As soon as they know the 75%, it affects their decision about the probability they assign. 74% and it’s below the radar, 75% and everyone is looking at it.
Many people (including me at some points in my life!) might be tempted to multiply the revenue by the chance of winning and use that. Let’s have a look:
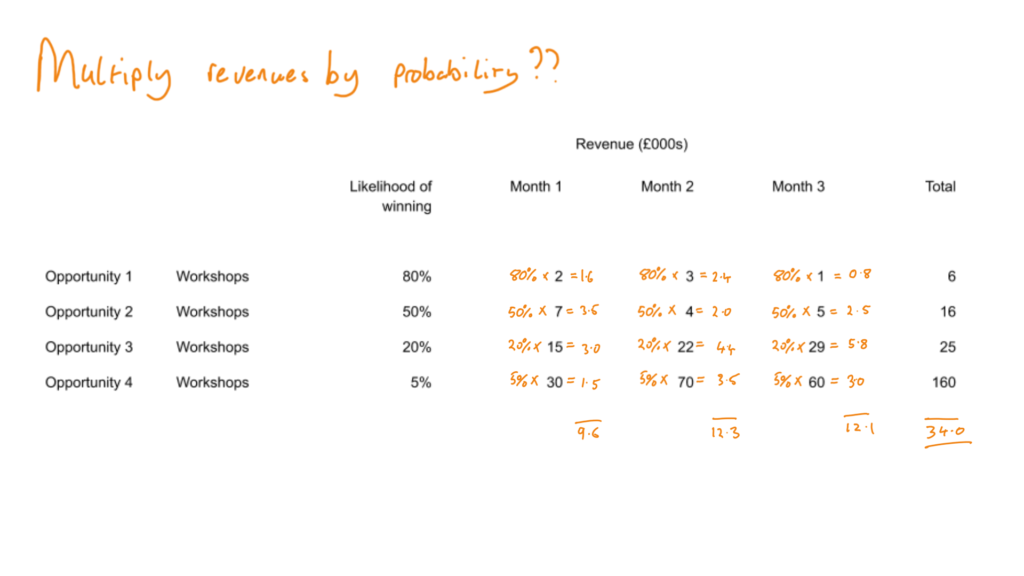
On the plus side, that method was explainable and repeatable. There was even some sort of logic to it. But:
- Would you go into a room of serious bankers and try to justify a sales forecast like this?
- Would you think this line gave you a full enough understanding of the strength of the pipeline to base your most important decisions on?
I wouldn’t. I can just look at the numbers and know that it misrepresents the truth. And there is no combination of potential outcomes that actually leads to that forecast. It’s not a real number and I believe it has zero value.
In the real world:
- It’s pretty likely we’ll win Opportunity 1
- We might win Opportunity 2
- We’d be lucky if we won Opportunity 3
- If we wanted to bet the farm on winning Opportunity 4 then we’d need an extraordinary reason!!!!
And here we run into a dichotomy:
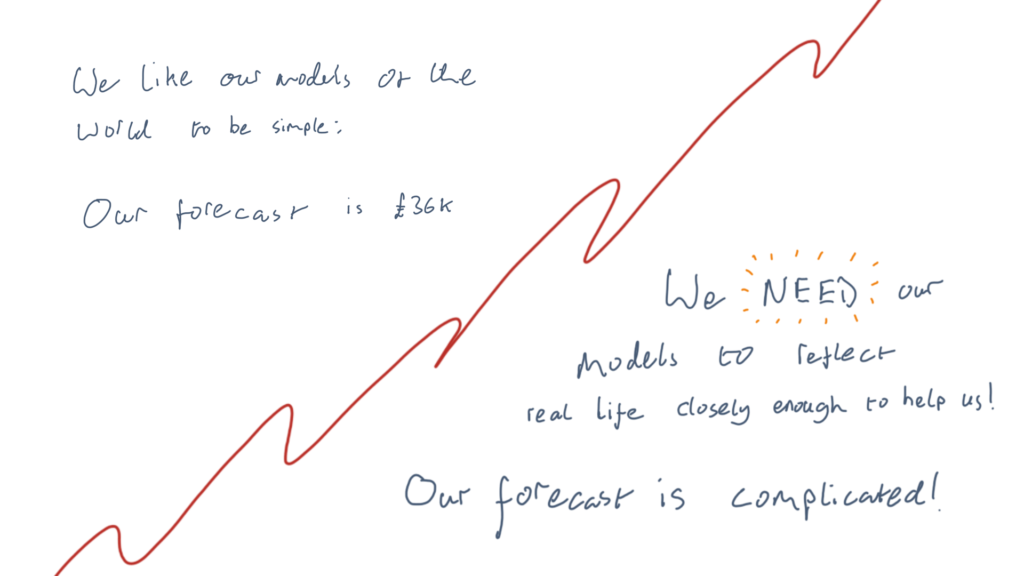
- As managers (or just people!), we like models to be simple so we can remember them. Ie. In the next 3 months, our sales forecast is £34.5k. The simplicity creates an air of certainty about the situation. In my view that certainty is fake and dangerous! I’ve written more extensively about fake certainty in my blog on Business Agility
- As managers, we need models that represent reality closely enough so we can use them to help us make decisions. When the situation is complex and the stakes are high, our model must be sophisticated enough that we’re not misled with naivety.
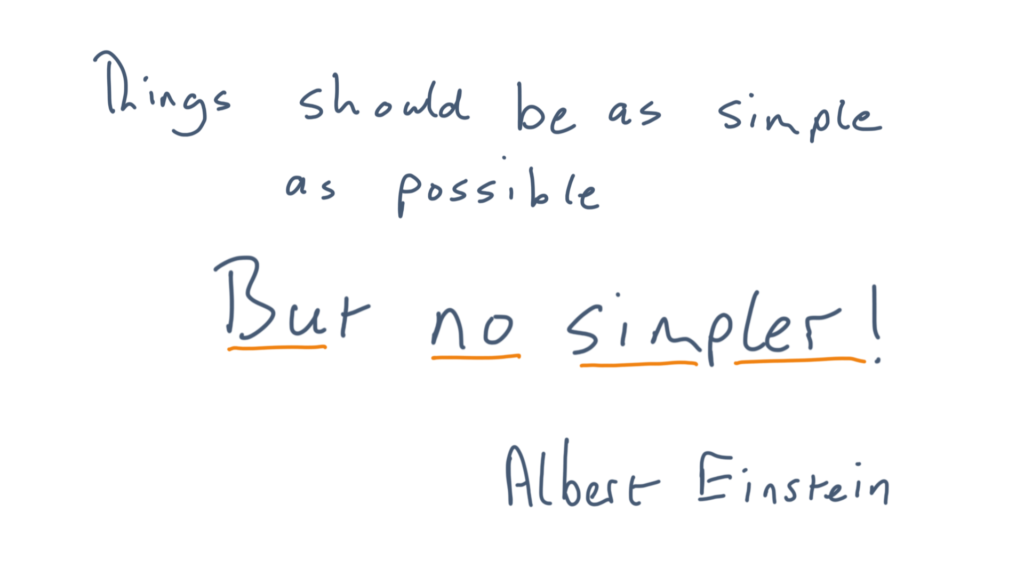
Einstein was onto something when he said that “Things should be as simple as possible, but no simpler”!
So what can we do?
Well, there is an interesting (to me at least!) method called “Monte Carlo Simulation”. The name suggests it might involve gambling and it relies on the fact that in a game of chance (say roulette) the results of an individual turn can vary wildly, but when it’s played long enough then the bank wins!! The randomness of a crystallised individual spin averages out over many thousands of turns.
In our world of sales forecasting, we can try crystallising a future scenario for each of the opportunities and see if we win the opportunity or not. If it’s 80% likely that we will win Opportunity 1 then we can generate a random number and if it’s less than 80% then we can say that in that crystallised version of the future, Opportunity 1 was won.
If you’ve never practised thinking in this way before, it’s probably worth lingering on the previous paragraph and I’ll give you another bullet point to try and help cement the concept:
- Out of all the possible futures, we randomly picked one that is no more or less likely than any of the others. We did that by generating a random number for each of the opportunities. We compare that random number to the chance of winning the specific opportunity and if the random number is less than the chance, then in that specific future, we win the opportunity. It might seem like a nonsensical thing to do! And if we only did it once then it would be. So bear with me for a while and let’s see where it goes!
As the opportunities are all unconnected then we can crystallise a potential future for each of them too with their own random number. Let’s see what that looks like :
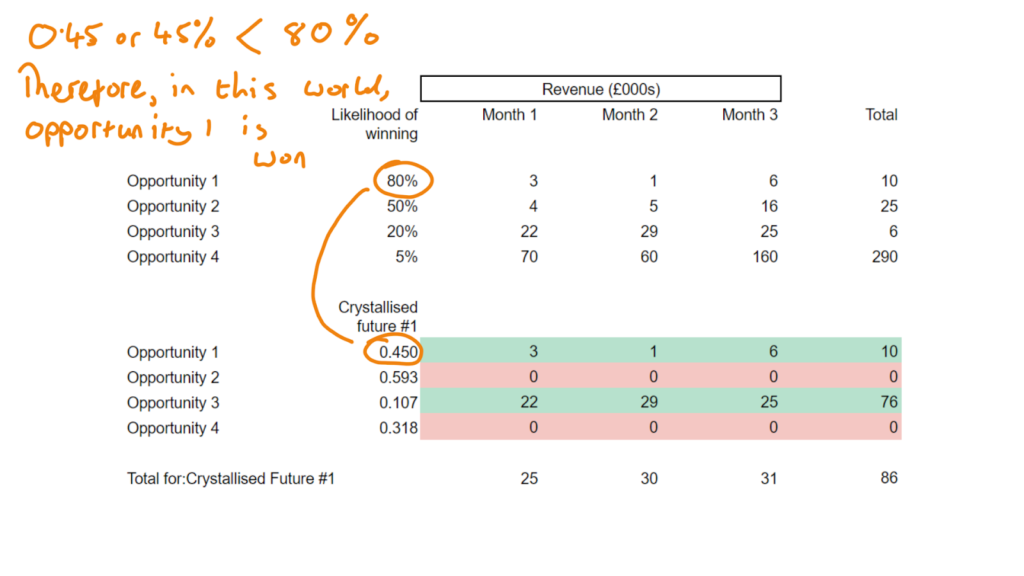
This tells us that in one possible future represented by the numbers in the column “Crystallised Future #1”, we would win Opportunity 1 and Opportunity 3. Our 3 month forecast would be £86k (25+30+31). Make sure you can see those numbers and where they come from on the grid.
“So what?” I seem to hear you say. And it’s not a bad call!
This single imagined future is no more likely than any other imagined future. Why should we pick this one? Why not create some more crystallised futures with different random numbers, perhaps they will be better?
The power of this thinking starts to appear when we realise that we can repeat it ten times and crystallise ten possible futures, each of them equally likely.
Brace yourself! The table below shows ten possible futures crystallised and with the associated revenue in months 1, 2 and 3. Can we conclude anything helpful from the data?
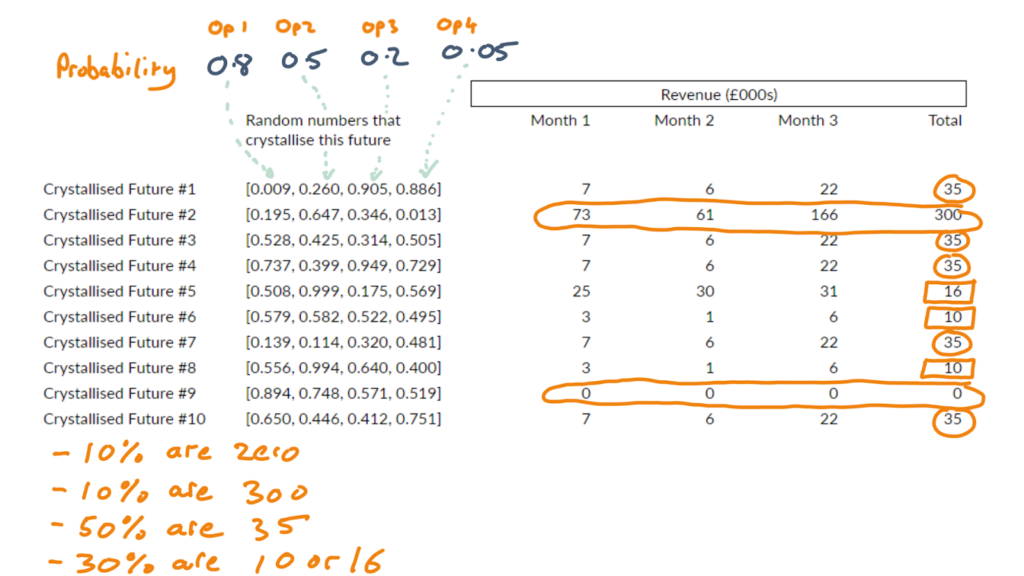
In these futures, we were so unlucky, that on one occasion (#9) that we didn’t win any of the opportunities. Man life sucks sometimes!!
A useful way to summarise these numbers is to say that:
- In 10% of the scenarios, the forecast was zero
- In 90% of the scenarios, the forecast was 10 or above
- In 30% of the scenarios, the forecast was 10 or 16
- In 50% of the scenarios, the forecast was 35
Now we can start to get a feeling for how likely we are to achieve certain numbers
If one crystallised scenario is worthless and ten seem to add some value, we could probably conclude that more scenarios would provide an even better insight.
So, if we can do it for ten, we can do it for a hundred, or a thousand, or a hundred thousand! Each of the crystallised futures just as likely and valid as any of the others.
When we generate enough random futures and analyse them carefully to see how many of those futures generate which results then we can get a much better understanding of what our future might actually hold.
The following graph shows a similar summary but considering 500 scenarios
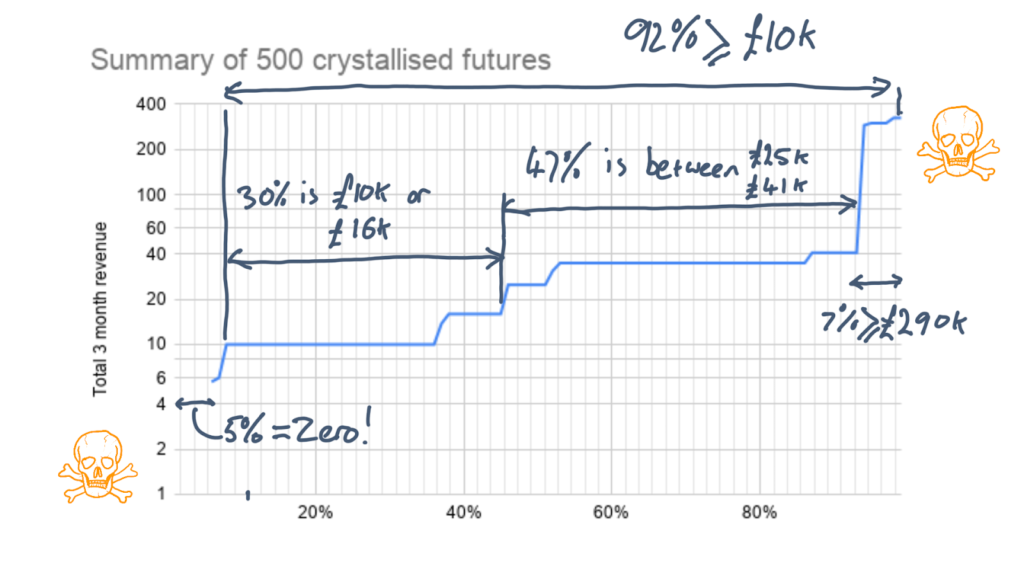
Take careful note that the revenue scale up the left hand side is logarithmic to make sure we can see the important detail at the lower levels. The x axis is the percentage of scenarios
Our understanding of our possible futures starts to become clearer and some key points to take out:
- In 5% of our futures, the sales projection is zero. Let’s not kid ourselves that zero is an impossible number. One in twenty is real enough for us to think hard about it and if we haven’t given any thought to what we’d do if it came up, we’ll probably be in some trouble.
- Talking of trouble, there’s a 7% chance our demand would be for more than £290k. We worked hard for that opportunity. Highlighting the fact that it might need to be delayed while we increase capacity means we can start to consider how we might position our messaging to leave that possibility open.
- On the flip side, in 92% of our futures, our 3 month forecast is £10k or more.
We’re analysing hundreds of crystallised, equally likely scenarios to see what outcomes they generate and using that to gain insight about our likely future. If you google: Monte Carlo Simulation, there’s a lot of additional material you can find.
The technique is really useful if you need to combine lots of dissimilar things that are uncertain.
I first came across Monte Carlo Simulations when I was talking with a client (mineral discovery etc) and as a throw away comment he mentioned that there was a room full of servers with high end graphics cards running hundreds of millions of Monte Carlo Simulations. It was a side comment and it would have wasted too much time to dig into it as we spoke. But my mind was racing! Hundreds of millions of Monte Carlo Simulations!!!! A bit of Google Fu on the train home and a whole new world opened up. Using randomness to simulate complex and uncertain situations many, many times and then analysing the distribution of those simulations to gain insight! Genius!
In this explanation of sales forecasting with Monte Carlo, I ignored some of the complexities of real life:
- Some opportunities aren’t independent, they are dependent on something else. For instance, it might be impossible to win the follow on opportunity if we hadn’t first won the exploratory phase. But winning the exploratory phase does not guarantee winning the follow on as that might not happen at all. Of course there are ways of constructing our model to take such situations into account and that’s what I did (eventually!) back in 2015.
- Getting good quality input data is never straightforward:
- One person’s view of 5% likelihood can be different to someone else’s
- Some salespeople like to stay cool about their opportunities until they are almost certain the PO is on its way. And some sales people start shouting much earlier! Getting a coherent view of all the opportunities is really difficult! I had to stay very close to all the salespeople and have a detailed understanding of all the opportunities. Together, we managed to keep our assessment of all the opportunities reasonably consistent. Sometimes, there’s just no alternative to hard slog!
Wrapping it up
We weathered the storm.
I did meet with the bankers and as I’d hoped, the preparation we’d done gave me strength.
I believed my numbers, my story was compelling, our bankers supported us and our credit lines remained in place.
When I first started to think about this blog I wanted to try for two things :
- Help more people to understand something about Monte Carlo Simulations. To me, the idea is beautiful, pragmatic and encourages us to recognise the fake certainty of single number forecasts. If you weren’t familiar with this type of thinking before, you have “smashed yourself into a new idea” and you’ve increased your ability to innovate on demand!
- Underline the importance of trying to foresee and then preparing far in advance for situations that could have the most serious (game over) outcomes. It’s impossible to do 6 months work the night before a critical meeting.
Thanks for taking the time to stay with me and I hope you found something interesting and useful.
If some transformational event is causing your organisation to become stressed and you’d like to discuss ideas for finding a path through, then please give me a call.
Peter Brookes-Smith
Curious problem solver, business developer, technologist and customer advocate
Other blogs by Peter
- Needles and haystacks or…
- The Case of Rev. Bayes v The Post Office
- Lighting a fire – Our first annual review…
- Helping Mine Detectors learn to use their equipment correctly
- How many?
- Finding defects with AI and computer vision
- Portfolio: PBS – Neural Net for Hand Written Digits
- CS50 – Harvard’s Open Computer Science Course
- What is a neural net anyway?
- Values Driven Business
- All things come to those that wait…
- What is business agility? And why should I care?
- Are values in business our fair weather friend?
- Lessons in life from an ai agent
- Five tools for innovation mastery
- Value for money
- Award entry for European CEO Magazine 2017
- Darwin and The Travelling Salesperson
- What is this DevOps thing?
Blogs by other authors:
- From Stubble to Squad Goals: Our Mo-numental Mo-vember Mo-arvel!
- Learning a Foreign Language vs. Learning to Code: What’s the Difference?
- Solving complex problems through code – and nature!
- In it together – why employee ownership is right for us
- Old Dogs and New Tricks: The Monte Carlo Forecasting Journey
- Portfolio: Rachel – Photo Editing
- Portfolio: Luke – Hangman
- Portfolio: Will – Gym Machines